Written by Ben Kumar, senior investment strategist, 7IM
You probably saw a headline like this sometime last week.
Source: BBC News
And the underlying story is based on the Office for National Statistics’ regular release of its GDP estimate.
Did you spot the important word in the previous sentence?
“Estimate”
The ONS have only 40 days after the end of the month to produce the GDP report.
Imagine having to get information on the ENTIRE output of the UK economy in that time – every car sold and flat white frothed, every supermarket shop and bus ride taken. No chance.
There’s always going to be some data that just isn’t available – often it takes months to get a really good picture.
So what ends up happening is that the data gets re-evaluated and revised once further info comes in.
The below chart shows the difference between the first estimate of three-month GDP growth and the final estimate, expressed as percentage change. If there are no revisions for the quarter, there is no bar, but spoiler alert … there are always bars:
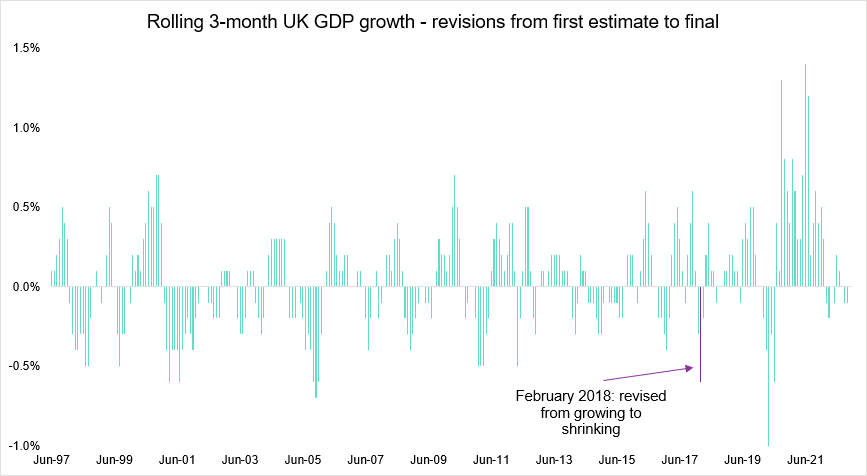
Source: 7IM/Office for National Statistics
Even excluding the COVID-19 period, you can see that these revisions can be meaningful – often more than half a percent higher or lower than the original number.
For example in February 2018, the first estimate suggested that the economy grew at 0.4%; in reality, we now know it actually shrank by 0.2%. Imagine the difference in headlines!
It’s a good reminder that the modern world’s desire for immediate data often means the quality of that data is compromised.