
Many believe UK housing offers a low-risk way to grow wealth. Duncan Lamont, Head of Strategic Research, Schroders, looks at what the facts say.
What’s better, property or pension? Many people in the UK would argue property. That’s one reason why study after study shows Brits don’t have a stock market investing culture. We’re property-mad.
According to the English Private Landlord survey, over half of all private landlords in the UK are using property as part of their retirement planning. 24% are small scale landlords who consider their properties long-term investments to contribute to their pension. Another 31% are already-retired landlords.
But do the numbers stack up?
There are many good reasons to be attracted to property ownership, such as the security of a roof over your head and a place to call home. The focus here is not to argue against these. But it is to challenge the consensus that property is a better investment than putting money into your pension.
The winner when it comes to return
Common reasons for favouring property are perceptions that it delivers better returns and is less risky. Neither is substantiated by the data.
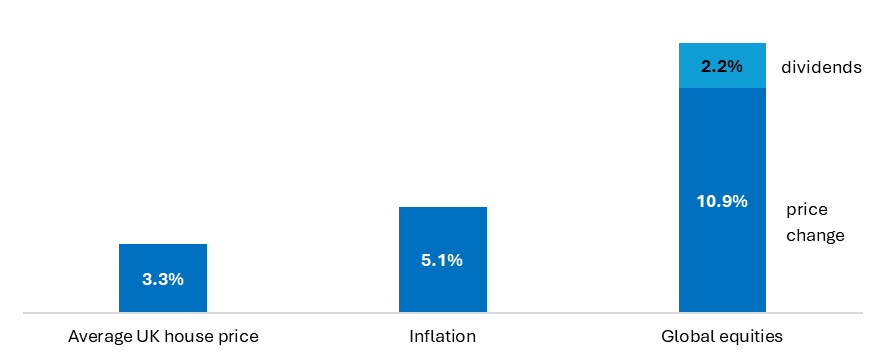
This has shown up particularly starkly in recent years. In the five years to the end of 2025, UK house price growth was 3.3% a year, well short of inflation which came in at 5.1% a year. In contrast, global equity prices were up 10.9% a year in sterling terms, 13% a year in total returns if dividends are included.
UK house price growth has fallen short of inflation in recent years but the stock market has soared
Last 5 years, % change p.a.
Past performance is not a guide to the future and may not be repeated
Data to 31 December 2025. Source: Global equities is MSCI World total return index in GBP terms. Source: LSEG Datastream, Land Registry, MSCI, Office for National Statistics, Schroders
A property bull would rightly respond that this is too short-term and property should be assessed over a longer horizon, but longer-term data also favours my position:
- Over the last 20 years in total, the value of the average UK property has only managed to roughly rise in line with inflation. Global equities are 7.3% p.a. ahead of inflation over the same period. This includes dividends but, even leaving them out, global equities have outperformed inflation by nearly 5% a year.
- Based on these numbers, in cumulative terms, a property worth £100k in 2005 is now worth £103k in inflation-adjusted terms. £100k in global equities is worth £410k.
- In nominal terms, your £100k house would be worth £182k but your stocks would be worth £728k (£450k if dividends are excluded from the calculation)
The average UK property’s value has barely kept pace with inflation over the past 20 years; stocks have quadrupled your money in inflation-adjusted terms
2005-2025 analysis
| Value of £100k 20yrs ago | 20yr annual growth % p.a. | |||
| Nominal | Inflation-adjusted | Nominal | Inflation-adjusted | |
| Average UK property | £182k | £103k | 3.0% | 0.1% |
| Global equities (including income) | £728k | £410k | 10.4% | 7.3% |
| Global equities (ignoring income) | £450k | £253k | 7.8% | 4.8% |
Past performance is not a guide to the future and may not be repeated
Data to 31 December 2025. Source: Global equities is MSCI World total return index and price index in GBP terms. Source: LSEG Datastream, Land Registry, MSCI, Office for National Statistics, Schroders
The stock market total returns include reinvested dividends whereas the property figures do not take account of rental income. However, gross rental yields have averaged around 6% for the past 20 years (with wide variation around the country and over time). This is before costs and expenses, with net rental yields typically 1-2% lower. Adding 4-5% p.a. to the property figures above would still leave global equities with a big advantage in total return terms.
This result is not dependent on the start point. Over the last 30 years, global equities have outperformed inflation by 7.3% p.a. Over 50 years they’ve done 7.8% p.a. It is true that property looks better over these more extended time periods, returning 3.8% and 2.8% ahead of inflation, respectively. But global equities are still well on top.
Borrowing to boost returns
Leverage – taking on a mortgage with which to buy a property – can materially boost property returns and has been a model much used by buy-to-let investors. But it also magnifies downside risks, depending on the quantum borrowed. The sharp house price falls in 2008 left many highly leveraged landlords with negative equity. Mortgage rates have also risen significantly since 2022, making borrowing less attractive for investors and placing some landlords in difficulty. In contrast, while leverage is allowable in pensions it is typically avoided by default fund investors.
The stock market has also been more consistent
Since 1969, five-year average UK house price growth has exceeded inflation 71% of the time. Pretty good. But global equities have done it 77% of the time. Switch to 10-year periods and house prices have beaten inflation 85% of the time but stocks 87%
So global equities have both a better overall return and a more consistent return. People say “there’s nowt as safe as houses” but the data says they’ve been less reliable than global equities.
Housing is about as undiversified as you can get
According to the English Private Landlord Survey, the average retiree-landlord owns just 1-2 properties with those using it as part of their retirement saving also owning just “a few”. Risk is highly concentrated.
Pick the wrong property type in the wrong area, and that one decision could have a material impact on your overall retirement savings, if you’re one of those who prefer property to investing via a pension.
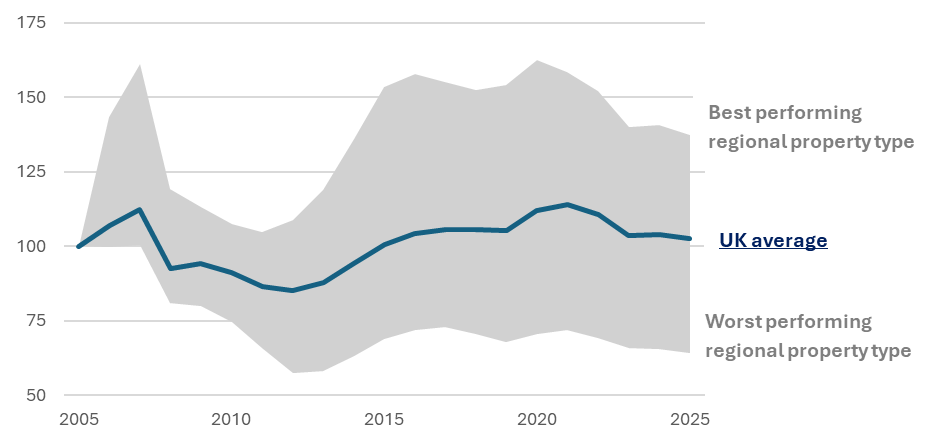
Across major regions and property types, an average £100,000 property 20 years ago is now worth anywhere between £64,000 and £137,000, in inflation-adjusted terms.
What would a UK property worth £100k 20 years ago be worth today in inflation-adjusted terms?
Shaded area shows max and min across four property types (detached, semi-detached, terraced, flat) and 12 areas of the UK (North West, North East, Yorkshire and the Humber, West Midlands, East Midlands, East of England, London, South West, South East, Scotland, Northern Ireland, Wales)
Past performance is not a guide to the future and may not be repeated
The shaded area shows the change in real value of the average detached, semi-detached, terrace and flat in the North West, North East, Yorkshire and the Humber, West Midlands, East Midlands, East of England, London, South West, South East, Scotland, Wales and Northern Ireland. i.e. 48 distinct areas/major property types across the UK. The blue line shows the UK average. Source: Land Registry, LSEG Datastream, Schroders
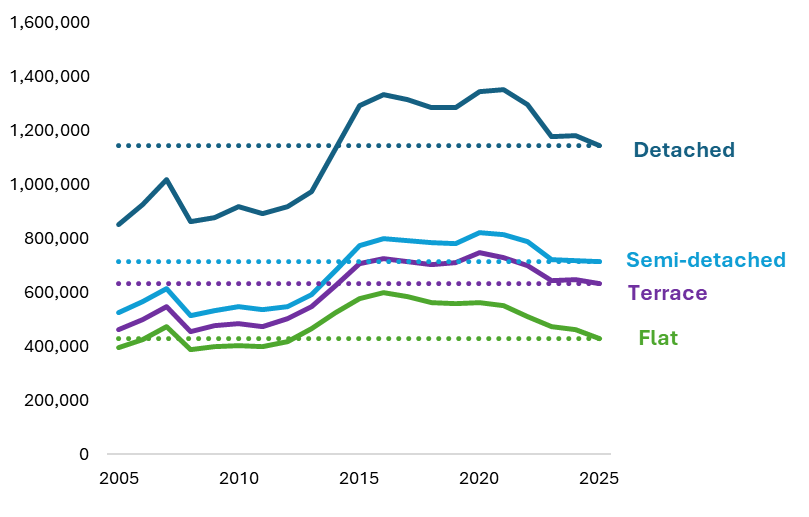
The value of flats has failed to keep pace with inflation in every major UK region over the past 20 years other than in London. The north east of England has been the worst performer, where the average flat has fallen in value by 36% in total in inflation-adjusted terms (-2.2% p.a.). Even London has experienced struggles in recent years. The average London flat is worth 2% less in nominal terms today than in 2016. In inflation adjusted terms it has fallen in value by nearly 30% over this period. London flats are back at 2006 prices in inflation-adjusted terms.
Houses have fared better than flats but even they have barely beaten inflation in most parts of the country over the past 20 years. As with flats, London’s recent experience has been less impressive. After recent falls, the average semi-detached, detached, and terraced London house is now back at 2014/15 prices.
A concentrated bet on a small number of properties exposes investors to significant region and property-specific risks
Property price growth over the past 20 years by region and property type, plus global equities, inflation-adjusted % p.a.
| Detached | Semi-detached | Terraced | Flat | Overall | |
| North West | 0.0% | 0.1% | 0.1% | -1.0% | -0.1% |
| North East | -1.0% | -1.0% | -1.1% | -2.2% | -1.2% |
| Yorkshire and the Humber | -0.2% | 0.0% | -0.1% | -1.5% | -0.3% |
| West Midlands | 0.0% | 0.1% | 0.0% | -1.4% | -0.1% |
| East Midlands | 0.0% | 0.1% | 0.1% | -1.3% | 0.0% |
| East of England | 0.5% | 0.6% | 0.5% | -0.8% | 0.3% |
| London | 1.5% | 1.6% | 1.6% | 0.4% | 1.0% |
| South West | 0.0% | 0.2% | 0.1% | -1.2% | -0.1% |
| South East | 0.6% | 0.6% | 0.5% | -0.9% | 0.3% |
| Scotland | 0.3% | 0.4% | 0.4% | -0.6% | 0.0% |
| Norther Ireland | -0.3% | -0.2% | -0.6% | -1.1% | -0.5% |
| Wales | -0.1% | 0.1% | 0.0% | -1.4% | -0.2% |
| UK average | 0.1% | 0.3% | 0.4% | -0.3% | 0.1% |
| Global equities | 7.3% | ||||
| Global equities (ignoring income) | 4.8% |
Past performance is not a guide to the future and may not be repeated
Global equities is MSCI World total return index in GBP terms. Source: Land Registry, LSEG Datastream, Schroders
London houses are back at 2014/15 prices, flats are at 2006 prices, in inflation-adjusted terms
London property prices in inflation-adjusted terms, 2025 prices
Past performance is not a guide to the future and may not be repeated
Source: Land Registry, LSEG Datastream, Schroders
Contrast this concentration risk with the global stock market. While pension investments used to have a notable “home bias”, today they are much more global. The MSCI World index is made up of over 1,300 developed market companies. There are another 1,200 in the MSCI Emerging Markets index. Your risk is spread out. It is true that the global stock market today is more concentrated than normal, with the 10 largest companies making up around a quarter of the global market. But this is still elite-level diversification compared with most property portfolios.
There is also the obvious problem that, if you need some cash, then property is illiquid. You can’t easily sell to raise that money. The only option would be remortgaging to release equity, but this comes with significant costs. This is both in terms of debt interest but also mortgage arrangement fees, often in the region of £1,000.
Valuations, taxes, costs and other considerations
People may reasonably argue that stock market valuations are elevated right now, but so are house prices. One measure of housing affordability is house prices vs earnings. We have constructed a series which stretches all the way back to the time of Queen Victoria (for the full historical analysis, see this earlier article).
On this measure, the value of the average house has decreased in recent years, from 8x to 7x average earnings. House prices have stagnated while earnings have risen. However, this is still a much higher multiple than for most of the twentieth century. It also takes no account of mortgage costs, which have soared. Home ownership remains an elusive dream for many.
UK house prices as a multiple of average earnings since the year 1845
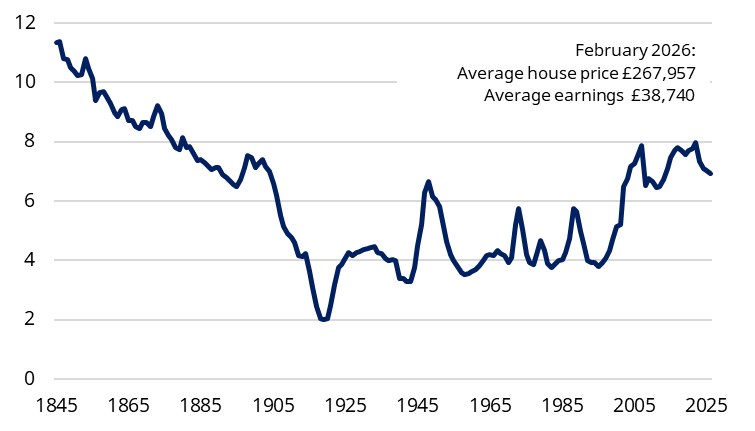
Source: Bank of England, Land Registry, Office for National Statistics, and Schroders
Two tremendous benefits of pensions over property are that:
- Your contributions are invested pre-tax. For a 40% taxpayer, every £60 of net pay becomes £100 in your pension. This is a 67% uplift (100÷60). This uplifted value can then grow tax-free within your pension. You will pay tax when you start to draw it down as retirement income but many people will be in a lower tax bracket at that time. Individuals can also withdraw 25% tax-free from age 55 (rising to age 57 in 2028). Note that this is not tax advice.
- All employers must contribute to an individual’s pension. It is free money. In addition, many offer to “match” all or some portion of additional contributions made by an individual. For example, if an individual opts to pay in an extra £100 a month, their employer will match that with an extra £100, doubling the amount.
Property ownership is also expensive, with upfront costs such as stamp duty and legal fees and ongoing costs including letting management fees, insurance and of course maintenance. Maintenance alone is plausibly around 2% of the value of a property, according to Bank of England research. Successive governments have also systematically reduced the financial appeal of buy-to-let e.g. the removal of tax relief for mortgage interest, and hiking of stamp duty rates on second homes.
There are no upfront costs when investing in a pension so you start day-one better. Ongoing costs in a DC pension are capped at 0.75% a year but typical fees are lower. Willis Towers Watsons’s DC Pensions and Savings survey found that the average charge in 2025 was around 0.3%.
Reducing the long-term real returns from equities by 0.3% p.a. or even 0.75% would not alter the earlier arithmetic which showed how much better stocks had performed than property.
Conclusion
For most people, property should be viewed as a complement to pensions, not a substitute. The data clearly shows that it doesn’t live up to the hype. In contrast, stock market investing, especially if within a pension, has an admirable track record. It’s time for many of us to re-assess our biases.