VCTs continue to be packed full of fast-growing early-stage businesses. Research by Wealth Club, the online broker for high-net-worth and sophisticated investors, shows that nearly half (48.4%) of VCT investments are in businesses that have grown revenues by more than 25% year-on-year. This is almost twice the rate on the UK main market where only a quarter of companies have grown revenues by 25% or more.
The average VCT had over a quarter of its money (26.4%) invested in businesses growing by more than 50%, while the UK main market has just 6.7%.
The research assessed the underlying operating performance of investee companies held by 21 VCT managers, covering 38 individual VCTs and 91.8% of the VCT industry by value. The data covers the last financial year before June 2023.
Revenue growth of VCT-backed companies versus UK listed companies
Nicholas Hyett, Investment Manager at Wealth Club, commented:
“Venture Capital Trusts have had a tough couple of years, hit by a general sell down in tech stocks which has fed through to lower valuations for small, fast growing companies.
But the fall in net asset value masks some very strong performances from underlying investments. Wealth Club’s market wide study shows VCT portfolio companies continue to see revenues growing strongly – far outpacing larger listed businesses.
Small businesses typically struggle most in an economic downturn, so the result might take some people by surprise. But the innovative, disruptive businesses that VCTs back behave a little differently. Because they’re taking market share from incumbents, or creating whole new services, they don’t rely on GDP growth to fuel expansion and that means they can grow even in tough economic environments.
That could bode well for the next few years. If the slide in tech valuations has stopped, and a slow down in interest rate rises makes that more likely, then from here on it’s successful revenue and profit growth that will determine the valuations for these small private businesses. There’s plenty of evidence of that in last year’s numbers.
Among the VCTs surveyed, an average of 26.4% of assets are invested in companies growing revenues by 50% a year or more. Standout performers include Pembroke VCT, where largest holding Lyma is benefitting from very strong sales of its laser skin care device in the US, and Triple Point VCT, which invests in the very youngest companies out there giving it the opportunity to participate in the fastest growth – albeit at a slightly higher level of risk.”
Behind the Research
We have looked at the investments made by 21 VCT managers who together are responsible for 38 VCTs and account for c.92% of the assets of all active VCTs.
To assess the growth of their underlying investments, we have divided portfolio companies into three categories:
- Revenue decline
- Modest growth: companies with revenue growth of 0-25%
- High growth: companies with revenue growth of 25%+
We’ve then applied the same categorisation to the constituents of the FTSE All Share excluding investment trusts and insurance companies.
By looking at the value of investments held in each category, we can see to what extent VCTs and the UK main market are exposed to fast-growing companies.
The numbers clearly show investors looking to gain exposure to high-growth companies are probably much better off looking at VCTs rather than the main UK equity.
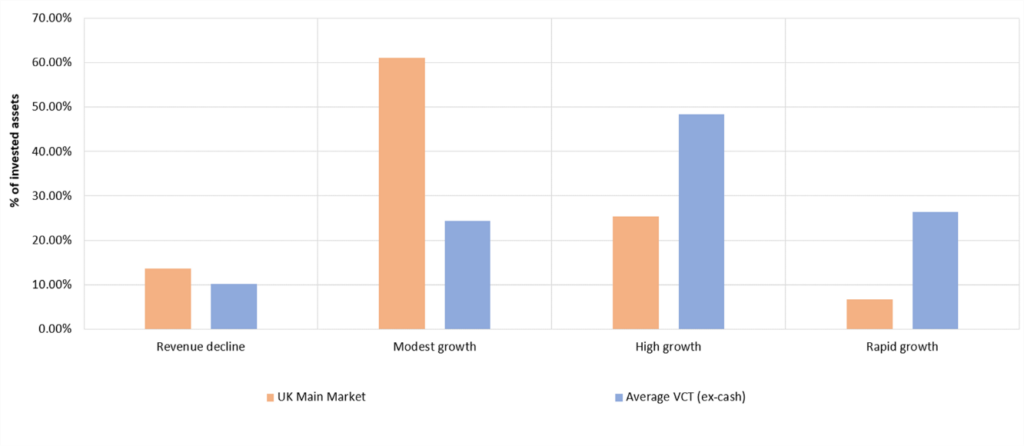
VCTs exposure to fast-growing companies

Chart shows the revenue growth exposure of 21 VCT managers as a percentage of their invested assets, compared with the revenue growth exposure of the constituents of the UK main market (FTSE All share excl. Investment Trusts and Insurance companies).
If we were to add a fourth category – rapid growth (companies growing revenues at over 50% a year) – VCTs fare even better.
26.4% of the VCTs portfolios are invested in companies growing revenues at 50%+, compared with just 6.7% (by market cap) of the main market.
The graph below shows the percentage of assets growing by 50% for each VCT manager.

Chart shows the revenue growth exposure of 21 VCT managers as a percentage of their invested assets, compared with the revenue growth exposure of the constituents of the UK main market (FTSE All share excl. Investment Trusts and Insurance companies).