
| Headlines | Dec-25 | Nov-25 |
| Monthly Index* | 543.0 | 545.2 |
| Monthly Change* | -0.4% | 0.3% |
| Annual Change | 0.6% | 1.8% |
| Average Price (not seasonally adjusted) | £271,068 | £272,998 |
* Seasonally adjusted figure (note that monthly % changes are revised when seasonal adjustment factors are re-estimated)
UK house price growth slowed sharply at the end of 2025, according to the latest Nationwide House Price Index released today, as higher borrowing costs and tax changes continued to shape buyer behaviour. Annual price growth eased to just 0.6% in December, the weakest pace since April 2024, with prices falling month on month after seasonal adjustment. While the headline figures point to a softer finish, the wider picture for the year remains one of resilience, with activity holding up and notable regional divergence across the UK. The full Nationwide statement follows below.
Commenting on the figures, Robert Gardner, Nationwide’s Chief Economist, said:
“UK house prices ended 2025 on a softer note, with annual price growth slowing to 0.6%, from 1.8% in November, the slowest pace since April 2024. The high base for comparison can partly explain the slowdown (annual price growth was a solid 4.7% in December 2024), although prices fell by 0.4% month on month, after taking account of seasonal effects.
Looking back on 2025
“Despite the softer end to the year, the word that best describes the housing market in 2025 overall is ‘resilient’. Even though consumer sentiment was relatively subdued, with households reluctant to spend and mortgage rates around three times their post pandemic lows, mortgage approvals remained near pre-Covid levels.
“Stamp duty changes that took effect at the beginning of April created volatility through the spring and summer. Activity spiked in March as purchasers brought forward transactions to avoid paying additional tax and this led to some softness in the following months. However, the underlying picture was little changed as demand held up well throughout.
“With price growth well below the rate of earnings growth and a steady decline in mortgage rates, affordability constraints eased somewhat, helping to underpin buyer demand. Indeed, the first-time buyer share of house purchase activity was above the long run average, supported by easier credit availability, with the share of high loan to value lending (i.e. with a deposit of 15% or less) reaching its highest level for over a decade.
Most regions saw modest house price growth
“Our regional house price indices are produced quarterly, with data for Q4 (the three months to December) indicating that most regions saw modest annual house price growth (see full table below).
“The only region to see an annual decline was East Anglia, where prices fell by 0.8% (this was the first annual decline in a region since Q2 2024, which coincidentally was also East Anglia and a fall of 0.8%).
“At the other end of the spectrum, Northern Ireland continued to outpace the rest of the UK by a wide margin, with prices increasing by 9.7% over the year. This was more than five times faster than the 1.7% recorded in the UK as a whole (in Q4) and nearly three times higher than the 3.5% recorded in the next strongest region (North West). This strong performance mirrored that in the border regions of Ireland over the same period.
“Despite these significant price gains, house prices in Northern Ireland are still around 5% below the all-time high recorded in 2007, while UK prices are almost 50% higher over the same period. As a result, the price of a typical home in Northern Ireland is currently around 79% of the UK average price, while in 2007 it was around 25% higher.
“Scotland broadly matched the wider UK trend in 2025 with annual house price growth of 1.9%. Meanwhile, Wales saw a slight increase in annual house price growth to 3.2% and was the only other part of the UK, apart from Northern Ireland, to see stronger house price growth in 2025 than in 2024.
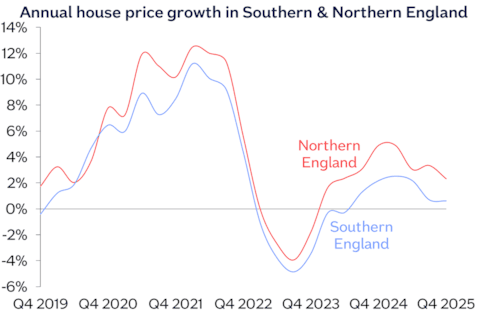
“England saw a further slowing in annual house price growth to 1.2%, from 1.6% in Q3. Average prices in Northern England (comprising North, North West, Yorkshire & The Humber, East Midlands and West Midlands) were up 2.3% year on year, with the North West (which includes areas such as Cheshire, Lancashire & Greater Manchester) the top performing region in England – with prices up 3.5% year on year.
“Average house price growth in Southern England (South West, Outer South East, Outer Metropolitan, London and East Anglia) was similar to last quarter at 0.6%. Annual price growth in London remained subdued, with prices rising by 0.7% in 2025, compared with a 2.0% rise in 2024. East Anglia was the weakest performing UK region and the only one to see an annual decline, with prices down 0.8%, compared with Q4 2024.
Flats continue to lag
“Our most recent data by property type shows that semi-detached properties saw the biggest percentage rise in prices during 2025, with average prices up 2.4% year on year.
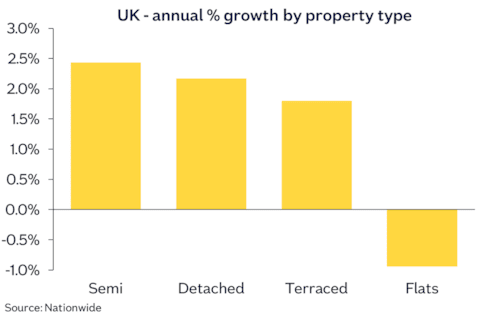
“However, detached properties saw similar growth of 2.2%, with terraced only marginally weaker at 1.8%. However, flats saw a small year-on-year decline of 0.9%.
“Flats have seen noticeably weaker growth than other property types in recent years. For example, over the last ten years, the price of a typical flat has increased by 18%, less than half of the rise in the price of terraced houses, which saw a 41% rise over the same period. This is partly a reflection of regional trends where London, which has a much greater proportion of flats, has underperformed the wider UK over the past decade.
“The underperformance of flats (and London more generally) may in part be a function of the change in demand seen during the pandemic. This resulted in a shift in preferences towards properties that offered more space and which has only partially unwound. In addition, the increased costs of maintenance, ground rents and service charges are also likely to have impacted buyer sentiment towards flats in recent years.
Where next in 2026?
“Looking ahead, we expect housing market activity to strengthen a little further as affordability improves gradually (as it has been in recent quarters) via income growth outpacing house price growth and a further modest decline in interest rates. We expect annual house price growth to be broadly in the 2% to 4% range next year.
“The changes to property taxes announced in the Budget are unlikely to have a significant impact on the market. The high value council tax surcharge is not being introduced until April 2028 and will apply to less than 1% of properties in England and around 3% in London. The increase in taxes on income from properties may dampen buy-to-let activity further and hold down the supply of new rental properties coming onto the market, which could, in turn, maintain some upward pressure on private rental growth.”
Quarterly Regional House Price Statistics – Q4 2025
Please note that these figures are for the three months to December, therefore will show a different UK average price and annual percentage change to our monthly house price statistics.
Regions over the last 12 months
| Region | Average price (Q4 2025) | Annual % chg this quarter | Annual % chg last quarter |
| N Ireland | £216,919 | 9.7% | 9.6% |
| North West | £225,665 | 3.5% | 3.2% |
| Wales | £213,894 | 3.2% | 3.0% |
| West Midlands | £250,865 | 2.3% | 3.0% |
| Yorks & The H | £212,110 | 2.3% | 3.8% |
| North | £168,317 | 2.2% | 5.1% |
| Scotland | £190,649 | 1.9% | 2.9% |
| Outer Met | £428,139 | 1.4% | 1.0% |
| East Midlands | £238,183 | 1.0% | 2.7% |
| London | £529,372 | 0.7% | 0.6% |
| South West | £308,228 | 0.5% | 0.9% |
| Outer S East | £336,561 | 0.1% | 0.3% |
| East Anglia | £269,912 | -0.8% | 1.1% |
| UK | £273,077 | 1.7% | 2.3% |
| UK Fact File (Q4 2025) | |
| Quarterly average UK house price | £273,077 |
| Annual percentage change | 1.7% |
| Quarterly change (seasonally adj.) | 0.7% |
| Most expensive region | London |
| Least expensive region | North |
| Strongest annual price change | N Ireland |
| Weakest annual price change | East Anglia |
Nations summary table
| Nations | Average price (Q4 2025) | Annual % chg this quarter | Quarterly % chg |
| N Ireland | £216,919 | 9.7% | 1.9% |
| Wales | £213,894 | 3.2% | 1.0% |
| Scotland | £190,649 | 1.9% | 0.5% |
| England | £310,005 | 1.2% | 0.7% |
Sharing his reaction to these data, Nathan Emerson, CEO of Propertymark, comments:
“Aspiring and current homeowners will no doubt have felt reassured heading into the end of the year, with falling inflation and base rates improving affordability and helping more buyers consider their next move during 2026.
“Given the number of policy and economic changes the housing market experienced throughout 2025, including legislative updates, mortgage rate fluctuations, and the Autumn Budget, a period of price stability is an encouraging outcome.
“Stable house prices provide a solid foundation for the year ahead, allowing buyers and sellers to make more informed decisions without the pressure of rapid price movements. As the market continues to adjust, this stability should support activity and confidence throughout 2026.”
Nicky Stevenson, Managing Director at Fine & Country, comments: “House prices eased slightly at the very end of the year, which is consistent with the seasonal slowdown we typically see as activity winds down ahead of Christmas. Fewer listings, fewer viewings and fewer completions at this time of year can all have a short-term impact on pricing, without signalling any deeper shift in the market.
“Looking back over 2025 as a whole, the housing market has proven more resilient than many expected. Despite affordability pressures and higher borrowing costs earlier in the year, prices broadly held up, and sales continued to go through, particularly where homes were priced sensibly and aligned with buyer expectations.
“Buyers have had more choice and more negotiating power than during the peak years, while sellers have had to be more realistic. That recalibration has helped underpin activity, even as headline growth moderated.
“Improving mortgage conditions in the latter part of the year also played a role in boosting buyer confidence. As rates edged down and inflation cooled, we saw renewed enquiries from buyers preparing for a move in the new year rather than rushing decisions before Christmas.
“As we move into 2026, the market appears well placed for a steadier, more sustainable phase. With greater policy clarity following the Autumn Budget and borrowing costs expected to ease further, there are solid foundations for activity to pick up again once the traditional spring selling season gets underway.”