Central to robust MPS due diligence by advisers and wealth managers are good data. This data section of our MPS Insights Report provides expert analysis from leading financial data company, FE fundinfo, of the UK MPS market. Jodie Gallagher, Head of UK IFA Products at FE fundinfo, looks back at how portfolio design has evolved over the past decade. Drawing on the FE Fundinfo’s MPS Universe data set, covering 1,500 models from 75+ providers used by more than 5,000 advisory firms, Jodie also identifies key trends in MPS and how data is now central to smarter, more agile investment strategies.
By combining granular performance metrics with forward-looking indicators such as style drift, risk decomposition, and attribution analysis, Jodie’s insights reveal how MPS providers are meeting regulatory requirements while empowering advisers to focus on the financial planning process. Her analysis offers a clear, evidence-based picture of the MPS market today, setting the context for the practical, and forward-looking view of the trends shaping MPS and how they can be applied in practice.
Over the past decade, the investment management industry has experienced a transformation unlike any before. This has been driven not only by regulation or product innovation, but by relentless data proliferation and cost pressures reshaping portfolio construction. In this environment, discretionary fund managers (DFMs) and active managers alike have been compelled to redesign their strategies, not simply to keep up with the competition, but to stay relevant in an increasingly transparent, performance-driven marketplace.
When assessing FE fundinfo Managed Portfolio Service (MPS) Universe data set, which is used by over 5000 financial adviser firms and has over 1500 models from 75+ providers, four key trends have emerged over the past ten years: long-term cost pressures and the pivot to passives, the recent revival of active management, the persistent decline in UK equity allocations, and the outperformance of model portfolio services MPS) relative to traditional mixed asset funds. Taken together, these themes tell a broader story about how market trends are reshaping portfolio strategy in 2025 and beyond.
Cost compression and the rise of the passive toolkit
Over the last ten years, the twin pressures of fee transparency and competitive differentiation have squeezed DFMs and active managers into a new shape. Technology has been a key differentiator, with access to unified data across different asset classes enabling many advisers to deliver better outcomes and client transparency, while raising the levels of competition.
At the same time, total portfolio costs have fallen by more than 43%, from 1.00% in early 2015 to just 0.56% as of June 2025. Within that, underlying fund charges have halved, from 0.68% to 0.34%.
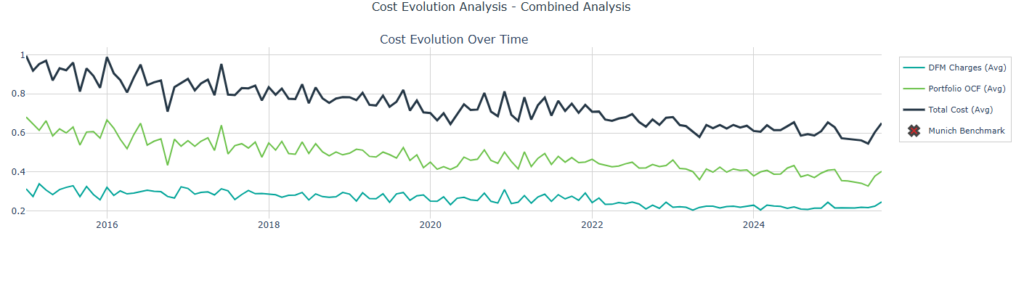
This drop is not a function of fund managers charging less for the same services. Instead, it reflects a systematic redesign of portfolios, replacing higher-fee active strategies with low-cost index vehicles. In 2015, the allocation to active funds accounted for 80% of the total universe, with just 20% allocated to passive. Today, the split is almost even, at 53% active to 47% passive, a remarkable change in practices
It’s not just fund selection that’s become leaner. DFM management fees, which once averaged 0.31%, now sit at 0.215%, a 30% reduction. This signals a broader industry shift: DFMs are no longer being paid solely for access to fund selection expertise but must demonstrate value through risk-adjusted outcomes, timely allocation decisions, and ability to deliver client outcomes.
Data has been central to this change. To design a lower-cost portfolio that maintains return potential, managers must model risk and correlation with greater precision. The era of buying best-in-class active funds across every asset class is over; in its place is a modular, data-driven toolkit where passives, factor-based strategies, and tactical overlays coexist in a flexible framework.
This evolution in design calls for a corresponding evolution in the investment strategies that support it. The value of any data point, from sector exposure to volatility metrics, now lies in how it enables more efficient, evidence-based decision-making. Portfolio managers who use these data points not only for returns but to demonstrate their methodology and results to clients have succeeded over the past decade.
Fig 1. Cost distribution and how total portfolio costs have fallen over the past decade
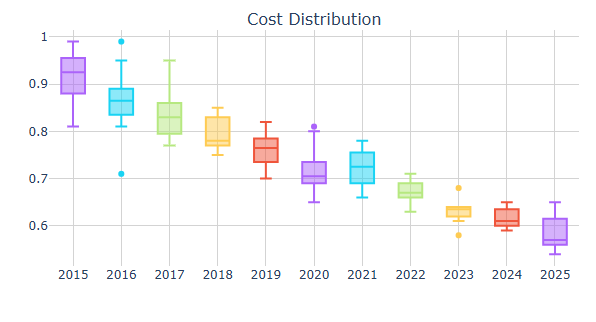
Source FE Fundinfo
A summer surge for active
After a decade of steady passive inflows, summer 2025 delivered a surprising shift, as the average allocation to active funds jumped from 53% to 66%. That was a 13 percentage point swing in just a few months. At the same time, total portfolio costs rose from 0.54% to 0.65%, reversing years of decline.
What’s behind this change? Early evidence suggests a renewed belief in the potential for alpha amid volatile macroeconomic conditions. Geopolitical volatility in the form of tariffs and sanctions has made many assets that investors may have previously assumed would lead to significant growth, such as US equities, be reassessed. Advisers have had to look elsewhere for steady returns.
Active managers, particularly in less efficient sectors like small-caps, emerging markets, and thematic equities, are being seen once again as worth their cost, especially if passive exposures are overly concentrated in mega-cap US tech. Media discussion over the summer of AI market bubbles, and an apparent move from many Big Tech founders to attempt to slow down a previously stratospheric AI hype cycle, have served to further hasten a move away from highly concentrated ‘Magnificent Seven’ tech stocks.
But this shift also reflects something more structural: the MPS industry has matured over this timeframe, with many institutional toolsets like attribution analysis, stress testing and risk decomposition, once only found on the desks of the big asset managers making their way into many MPS providers as assets under management have increased. The industry’s improved ability to select and monitor active managers using quantitative performance data, consistency metrics, and forward-looking indicators such as style drift and capacity constraints has subsequently impacted investment decisions and product design.
In short, data hasn’t just enabled the rise of passive. It’s enabling a smarter approach to active. The key question is whether this active renaissance is a cyclical response to market dislocation or the start of a new trend powered by better data and selection methodologies.
But even at this stage, one thing is clear: the blunt binary of “active vs passive” is giving way to a more sophisticated model of blending exposures for purpose, using data to justify every decision.
Fig 2 Shows passive v active flows
Source: FE fundinfo
The decline of UK equities
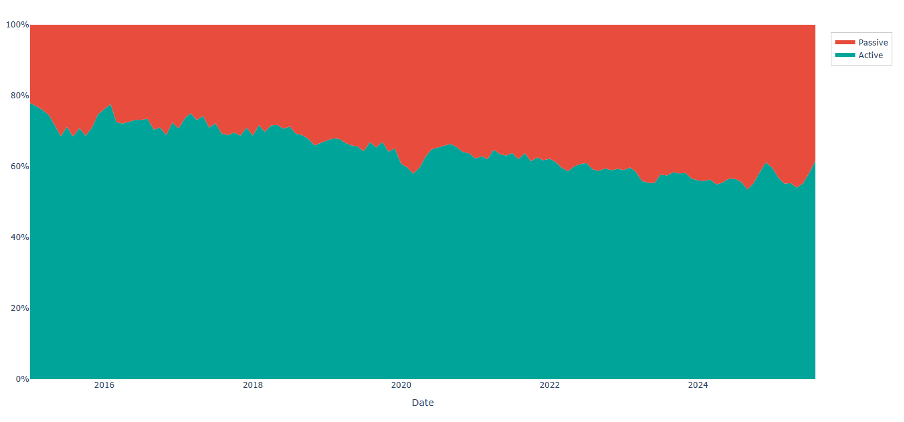
If cost and performance shape investment strategy, then consensus is its shadow. Nowhere is this more apparent than in the sustained fall of UK equity allocations over the last decade. Between 2015 and 2025, the average allocation to UK equities within model portfolios decreased from 16% to 5%. That’s not a marginal rotation. It’s a decisive exit.
This retrenchment has occurred despite attractive UK valuations, solid dividends, and relatively resilient economic fundamentals. So what’s driving it? The UK’s exit from the EU, followed quickly by a succession of short-term prime ministers, made the previously stable market look volatile and significantly more risky. Pandemic-era UK equity growth failed to turn into long-term sustainable returns, like it did in other markets such as the US. Outside of the macro factors, our data shows a high degree of trend-following among model portfolio providers. This is most evident in the dramatic narrowing of the UK allocations over time.
Back in 2015, 50% of all portfolios held between 12.5% and 25% in UK equities. By 2025, that range has compressed to between 5% and 13%. In other words, not only is UK exposure lower, but there’s far less dispersion, suggesting a powerful herding effect based on momentum and perceived opportunity cost relative to global exposures.
This reveals a subtle but important data strategy risk: when everyone is using similar indicators, portfolio design converges. That’s efficient in the short term, but dangerous in the long term, especially when valuation dislocations arise. If every financial adviser is using the same assets to deliver returns, then they’re not effectively differentiating from competitors in this area. An evolving data strategy must not only capture prevailing trends but alert managers to where consensus has become crowded or mispriced.
DFMs that can blend backward-looking performance data with forward-looking fundamentals and sentiment indicators will be better placed to identify contrarian opportunities and avoid being the last to rotate back in when sentiment turns.
Fig 3. Showing asset class distribution shifts in UK
Source: FE fundinfo
MPS models outperforming unitised mixed asset funds
The rise of Model Portfolio Services (MPS) has been one of the defining structural shifts in UK investment distribution Within advice firms, a clear preference for focusing on financial planning and servicing clients over investment analysis and portfolio construction has seen a decade long trend to outsourcing investment management; accelerated by the rising costs and complexity of regulation, starting with the Retail Distribution Review and unlikely ending with the Consumer Duty. As demand for more personalised, transparent services grows, even large firms that have, thus far, preferred to keep investments in-house are finding themselves with less time to focus on portfolio construction, subsequently the growth in MPS shows no sign of slowing down.
But it hasn’t just been about accessibility or regulatory alignment. Performance data now shows that, where a like-for-like comparison exists, MPS portfolios are outperforming their unitised counterparts in the IA Mixed Asset sectors.
This is particularly notable in the 30-45% growth space (as shown in Fig 5.) where MPS portfolios, despite having lower equity weightings than the IA 20-60% sector average, are broadly matching them for performance. Meanwhile, in the 65-85% growth category (as shown in Fig 6), MPS portfolios have outperformed their IA peers in every one of the past 10 years.
The consistent outperformance of MPS portfolios can be attributed to three key factors: their agile allocation capabilities, allowing DFMs to respond swiftly to market changes compared to the rigid structures of unitised funds; the freedom to select best-in-class funds without internal constraints or brand loyalty, enabling optimal risk-adjusted exposure; and enhanced cost control through access to preferential share classes and the use of lower-cost passive strategies, all of which contribute to improved net returns.
These advantages compound over time. One explanation might be that many MPS products are designed around strategic asset allocation, in large part thanks to the need to integrate with the many risk profiling tools that are so prominent in the advice process. With asset allocation widely proven to be the most significant driver of portfolio returns, focusing on this element of portfolio construction rather than rather than market timing or fund selection could well be beneficial. Maximising returns from beta might be a superior strategy to chasing alpha.
As MPS becomes a core offering across advisers, platforms and networks, the data demands will only increase. Demonstrating repeatable outperformance in a cost-conscious environment requires not just skill, but proof. This requires clean, granular, real-time data that can be sliced across asset classes, volatility ranges, time periods, and attribution frameworks. Most importantly, it needs to be understandable to clients.
Fig 4. Shows UK MPS 15-30% Growth TR V IA Mixed Inv. 0-35% Shares TR
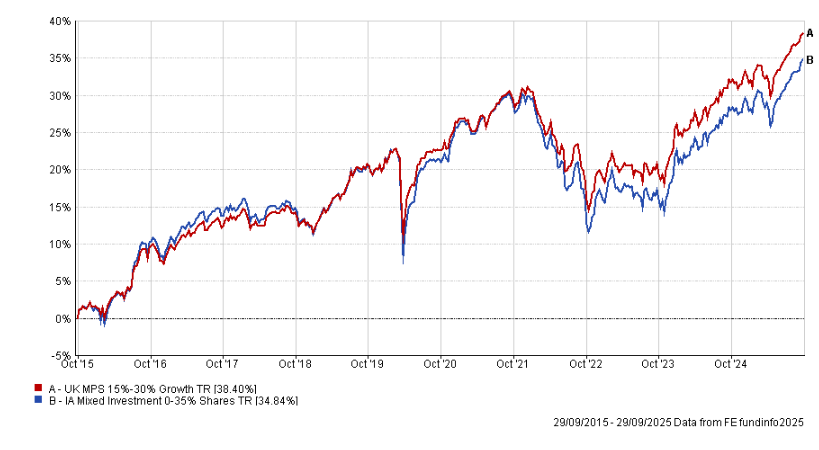
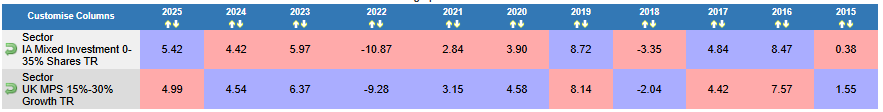
Source: FE fundinfo
Fig 5. Highlights 10 year growth in the UK MPS 30-45% Growth space
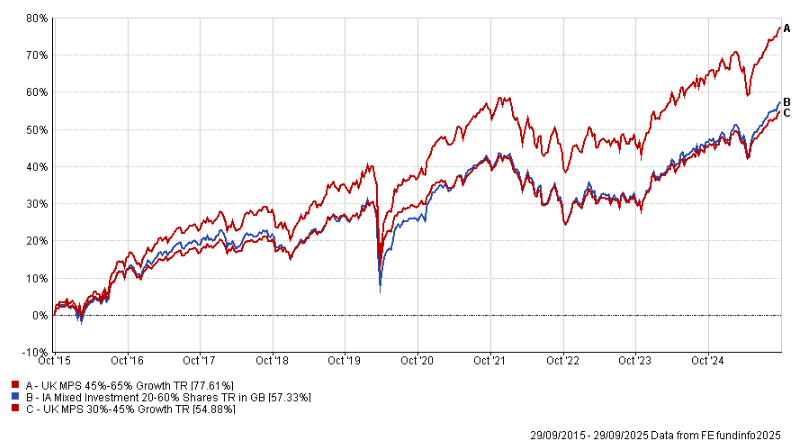
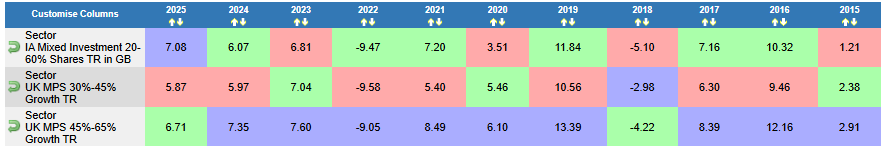
Source: FE fundinfo
Fig. 6. Shows UK 65-85% growth category MPS portfolios have outperformed their IA peers in every one of the past 10 years.
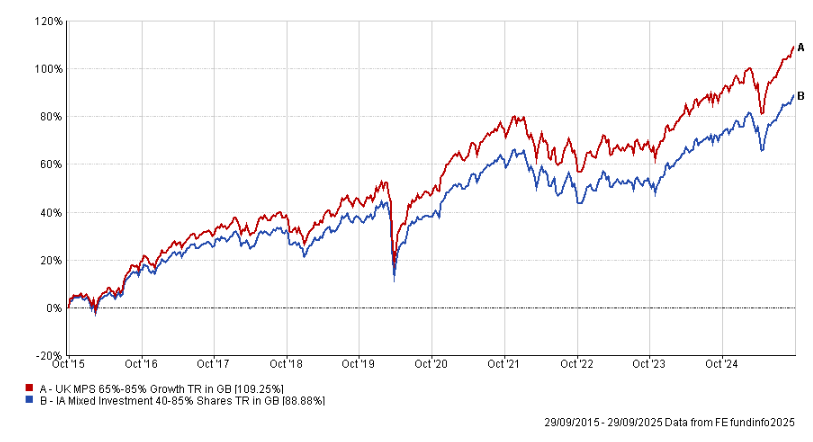
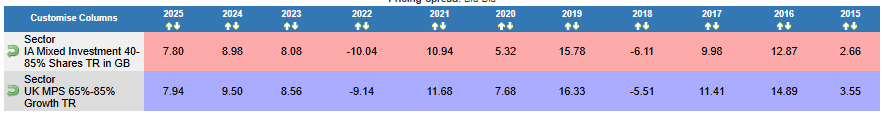
Source: FE fundinfo
From static to strategic – the new MPS mindset
The four themes which I’ve outlined above all point to a central truth: portfolio design is no longer a static process but a dynamic discipline. One where data on market trends will be essential to not becoming outdated in a rapidly evolving MPS marketplace.
In evaluating a DFM, an adviser must now look at not just current returns or costs but also their ability to adapt.Being able to evaluate a discretionary portfolio range through market cycles and through the lens of industry trends will be a key part of any selection process going forwards.
IFAs have become more active in their choice of investment partners, with more data comes more turnover. As preferences among investors change, so too will the selection of recommended MPS within an advice firm. While price and performance will remain a key battleground, with so many things able to distort short term performance, being able to demonstrate an ability to respond changing market environments and client demands and continue to deliver portfolios that meet client expectations will prove an incredibly valuable tool to retaining a place on panel. Increased data availability will see competition on not just price and performance, but on risk, strategic flexibility and diversification too.
About Jodie Gallagher
Jodie Gallagher is Head of UK IFA Products at FE fundinfo. She leads the group’s wealth product team to deliver data-driven solutions for the UK investment and advice market, with expertise in product strategy, operations, and development. Jodie has built her career at FE fundinfo over the past 13 years, working across the business to design and deliver products for both asset and wealth managers.
She played a key role in the development of the document production suite and is a core contributor to the Nexus strategy. Her focus is on building scalable, customer-centric products that drive meaningful value for the industry.
This feature was part of our MPS Insights 2025 publication – designed with advisers’ needs in mind. You can download your copy of the publication here…. https://ifamagazine.com/2025-managed-portfolio-services-mps-insights/