- Performance chasing has beaten buy and hold as an investment strategy over the last ten years
- Bargain-hunting has produced dismal returns
- Following the herd and contrarian investing have delivered curiously close results
- Why NOT to chase performance
Laith Khalaf, head of investment analysis at AJ Bell, comments:
“Everyone knows that chasing fund performance is a fool’s errand. Except for the fact that in the last ten years, it’s yielded terrific results. Investors who each January had put their money into the best performing fund sector of the previous year would be rolling in it, registering a 173.6% return over the decade. Or to put it another way, £10,000 initially invested in this strategy ten years ago would now be worth £27,360. That compares favourably to a buy and hold investment in a global equity fund, which would have produced £24,184 over the same period.
“Performance chasing has compared even more favourably to its antitheses, bargain-hunting. Investors who each January hopefully put their money in the worst performing fund sector of the previous year, in anticipation of a bounce back, would have seen a woeful return of just 42% over ten years. That’s a bit of a disaster given the risks taken as part of such a strategy, and brings to mind the well-worn advice about the dangers of catching falling knives. Or indeed the observation that an investment which has fallen by 90% is one which has fallen by 80%, and then halved in value.
| 10 Year | ||||||
| Total return | £10k invested | Worst annual performance | Best annual performance | |||
| Performance chasers | 173.6% | £27,360 | -14.2% | 44.4% | ||
| Buy and hold global | 141.8% | £24,184 | -11.1% | 23.3% | ||
| Egg spreaders | 107.9% | £20,786 | -9.6% | 22.1% | ||
| Herd investors | 80.8% | £18,084 | -11.1% | 21.9% | ||
| Contrarians | 77.1% | £17,709 | -11.2% | 22.2% | ||
| Bargain hunters | 42.0% | £14,203 | -24.0% | 47.1% | ||
Sources: AJ Bell, Investment Association, FE
“Spreading your eggs evenly across five key equity regions at the beginning of each year hasn’t delivered quite the stellar returns of performance chasing, but it has limited the downside in terms of annual losses. (Putting 20% of your portfolio into each of UK, US, European, Japanese and Global Emerging Markets funds, and rebalancing annually). Herd and contrarian investors, who respectively put their money into the most and least popular fund sectors of the previous year have curiously produced pretty similar performance over the last decade. The most popular and least popular sectors with retail investors do tend to be mainstream areas of investment though, which may explain more middling performance.”
Why NOT to chase performance
“These past performance figures suggest investors will be well served by performance chasing, but we should remember that historical data isn’t necessarily a reliable guide to the future. Raw statistics do need be overlaid with some common sense. There is still every reason to be wary of performance chasing, as an area which has performed well in one year has probably become a crowded trade and vulnerable to both overvaluation and profit-taking.
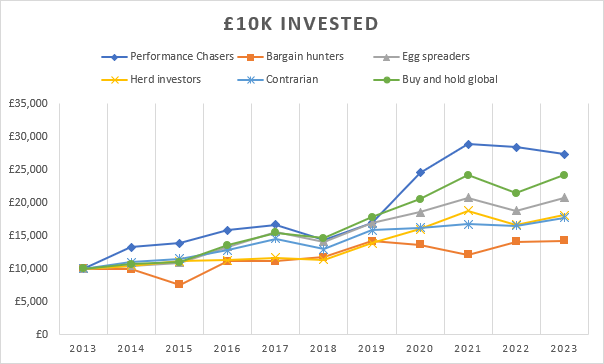
“This may have been mitigated in recent times as trends have tended to be quite long in the tooth over the last decade, most notably in the technology sector, which in both 2020 and 2021 performed so well that those two years account for two thirds of the returns experienced by the performance chasing strategy in our analysis. The technology fund sector returned a whopping 44.4% return in 2020 and followed this up with a 17.7% return in 2021. Nice work if you can get it. The chart below shows how that tech-fuelled performance during the pandemic really helped the performance chasing approach pull away from the pack.
Sources: AJ Bell, Investment Association, FE
“Performance chasing has also been a pretty high octane approach in terms of the specialist fund sectors investors have found themselves in over the last decade, such as technology, healthcare, India, China and commodities. This is reflected in the wide range of annual return outcomes, ranging from a loss of 14.2% to a gain of 44.4%. The same is true of bargain-hunting, as the extremes of performance, both positive and negative, tend to occur in the most specialist funds, exhibiting low levels of diversification across industry or geography. Holding a global equity fund would have returned 141.8% over ten years, but it would also have been a smoother ride, with investors seeing an 11.1% fall over any given calendar year, compared to 14.2% from a performance chasing strategy.
“Things have been more brutal for performance chasers in the past. In 2000 you would have had to endure a 31% fall in your portfolio from following a performance chasing approach compared to a 5% fall from the average global equity fund. In 2008, performance chasers would have seen their portfolios fall by 45%, compared to a 24% fall from a global equity fund. This was backed up in 2009 with another 11% fall from a performance chasing approach compared to a bounce back of 23% from a global equity approach. Over these two years in the financial crisis, a performance chaser would have had to stomach a 50% fall in the value of their portfolio, whereas a buy and hold global equity investor would be sitting on a loss of just 7%.
“If you’re engaged in performance chasing, there’s also the costs of switching your investments around to consider, and the faff of doing so. Factoring in risks, costs and complexity then, a buy and hold approach is preferable, even though it hasn’t yielded quite as much over the last ten years.
“The returns from a buy and hold strategy also very much depend on what you are buying and holding. A global equity fund is probably the most likely candidate as an investment for such a strategy. But there are some more specialist areas where a buy and hold approach would have bested a performance chasing strategy, as the table below shows. However to have your whole portfolio invested in just one of these areas would be an extremely risky proposition, and come with some nasty spills along the way.”
| Fund sector | 10yr total return |
| Technology | 331.8% |
| India | 264.3% |
| North America | 230.6% |
| Healthcare | 180.2% |
| North American Smaller Companies | 174.8% |
| Performance Chasers | 173.6% |
| Global | 141.8% |
Source: FE
Fund sectors used in different strategies
| Performance Chasers | Bargain hunters | Egg spreaders | Herd investors | Contrarian | |
| 2014 | Healthcare | Global EM Bonds | 20% into each of UK funds, US funds, European funds, Japan funds, Global Emerging Markets funds | Mixed 20-60% | £ Corporate Bond |
| 2015 | IA India | Latin America | UK Equity Income | UK All Companies | |
| 2016 | European Smaller Companies | Latin America | Targeted Absolute Return | UK All Companies | |
| 2017 | Commodity/ Natural Resources | Short Term Money Market | Targeted Absolute Return | UK All Companies | |
| 2018 | China/Greater China | USD Government Bond | £ Strategic Bond | UK All Companies | |
| 2019 | Healthcare | European Smaller Companies | Global | UK All Companies | |
| 2020 | Tech & Telecoms | UK Direct Property | Global | Targeted Absolute Return | |
| 2021 | Tech & Telecoms | Latin America | Global | Targeted Absolute Return | |
| 2022 | India | Latin America | Global | IA UK Equity Income | |
| 2023 | Commodity/ Natural Resources | UK Index Linked Gilts | Volatility Managed | UK All Companies |


![[uns] house of commons, parliament](https://ifamagazine.com/wp-content/uploads/wordpress-popular-posts/788873-featured-300x200.webp)


![[UNS] tax](https://ifamagazine.com/wp-content/uploads/wordpress-popular-posts/788955-featured-300x200.webp)